TCWGlobal
When a Proposal Becomes a Brand Showcase
This deck was created as a global RFP response for TCWGlobal’s Employer of Record services. I structured it to balance credibility, clarity, and personality—layering in leadership bios, value propositions, compliance proof points, and a global footprint overview. Data-heavy sections were translated into charts and infographics, while service offerings were positioned to support a compelling customer narrative. The visual tone is corporate-polished yet human, reinforcing trust without resorting to templated dullness. This project sharpened my ability to synthesize detailed input from multiple stakeholders and bring consistency to a high-visibility, high-stakes proposal.

TCWGlobal
HR Slides That Won’t Put NVIDIA Engineers to Sleep
To fix brand drift across departments, I built a modular template in PowerPoint using standard fonts, locked master slides, clear hierarchy, and on‑slide prompts for content owners. (Exlore the Template Deck) Once implemented, it drastically reduced design support requests and allowed every team (from HR to Sales) to create polished decks with minimal oversight.
The same system powered our NVIDIA worker orientation and customer retention decks, which I also designed using this template. (Check out the Retention Deck ) These live decks reflect my cross-functional communication skills, scalable design thinking, and ability to turn visual systems into everyday tools for non-designers.
City 24
Turning a Snooze‑Fest Prospectus into an Investor Magnet
I inherited a 48‑slide investor prospectus crammed with dense tables and boilerplate copy. (Check out the before version) Working solo and on a tight clock, I rebuilt the narrative around three C‑suite questions (risk, return, timeline) then merged Excel data into branded charts, introduced iconography, and tightened the flow to 16 slides. The cleaner deck secured three additional lenders and advanced a $16.5 M development to the term‑sheet stage. Along the way I demonstrated rapid, low‑touch iteration, executive storytelling, and data‑driven design.

HotBox
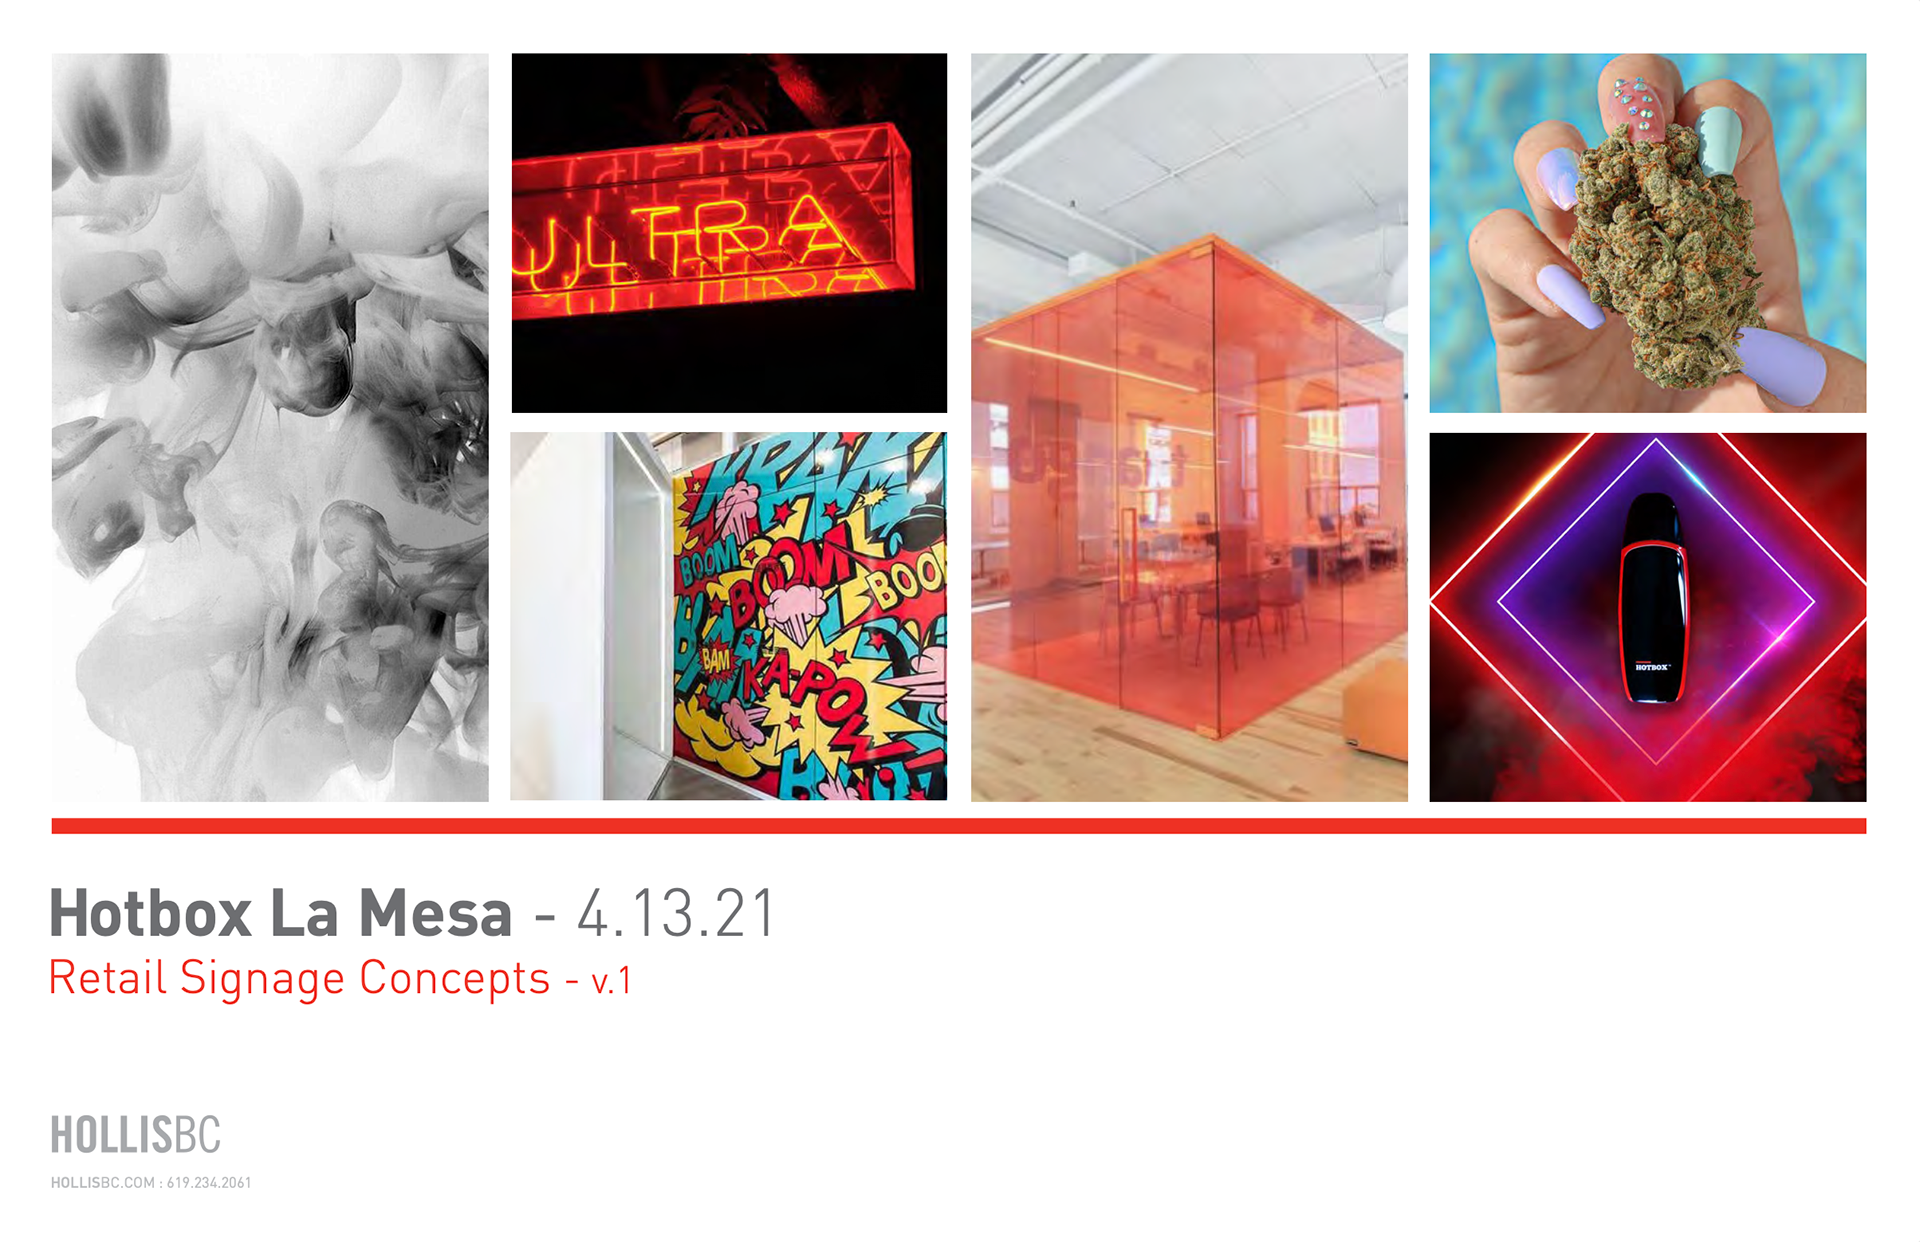
Greenlighting a Cannabis Signage Rollout
Retail expansion required a deck that could quickly walk executives through code‑compliant signage, material options, and phased installation costs. I combined elevation studies, annotated renderings, and a punchy cost‑benefit model to create a single meeting–ready presentation. Leadership approved the full rollout on the spot, accelerating city permitting and construction timelines by weeks. This work shows my ability to visualize technical detail, translate jargon into clear visuals, and drive confident, time‑sensitive decisions.
Pin Plus
Tossing Out the Clutter, Keeping the Insight
This one-pager was pulled from a larger quarterly waste and recycling report for Pin Plus, a waste management company. While I can’t share the full deck due to proprietary data, this snapshot showcases how I transformed raw operations metrics (volume by category, service savings, and customer support touchpoints) into a clean, scannable visual. With a mix of iconography, layout strategy, and simplified data storytelling, I helped turn trash metrics into clarity for stakeholders. It's a tidy example of how I translate complex datasets into something useful, usable, and well-contained.